Human cognitive architecture is inherently optimized for linear, small-scale environments. Evolutionarily calibrated to manage immediate resource constraints—such as quantities of livestock, tribal counts, or days of provisions—the human brain struggles when processing large numbers. When faced with quantities exceeding standard operational thresholds, the mind defaults to an undifferentiated categorization of massiveness, treating millions, billions, and trillions as functionally interchangeable concepts representing infinity.
This cognitive limitation introduces significant errors in corporate strategy, macroeconomic policy, and venture capital allocation. Failing to isolate the order-of-magnitude differentials between these figures distorts risk assessment and resource valuation. To correct this bias, we must dismantle the abstract figure of $1,000,000,000,000—one trillion—and evaluate it through physical engineering metrics, temporal dimensions, and systemic fiscal dynamics.
The Volumetric Mechanics of Currency
Visualizing one trillion units requires moving beyond digital balances to evaluate the physical properties of physical currency. Using standard United States currency as a baseline model provides a uniform, tangible metric for physical quantification.
A single Federal Reserve note, regardless of denomination, possesses uniform physical dimensions: a width of 2.61 inches, a length of 6.14 inches, and a thickness of 0.0043 inches. The mass of any individual bill is precisely one gram.
If one trillion dollars were aggregated using one-dollar bills, the total mass would equal $1,000,000,000$ kilograms, or one million metric tons. From a logistics standpoint, transporting this mass using standard commercial freight would require roughly 40,000 heavy-duty semi-trucks, creating a shipping bottleneck that exceeds the capacity of most regional transport hubs.
To optimize the volumetric density of this physical asset, the analysis must shift to the highest denomination in active circulation: the $100 bill. By substituting $100 bills for singles, the required volume contracts by a factor of 100.
- The Single Packet: 100 individual $100 bills comprise a standard bank packet. This packet holds a value of $10,000. It measures roughly 0.43 inches in thickness and retains a negligible weight of 100 grams, easily fitting within standard consumer luggage.
- The Million-Dollar Threshold: Scaled up, one million dollars comprises 100 of these packets ($10,000 \times 100$). The physical volume of this stack is approximately 0.4 cubic feet, weighing 10 kilograms (22 pounds). This entire sum can be transported in a standard commercial backpack.
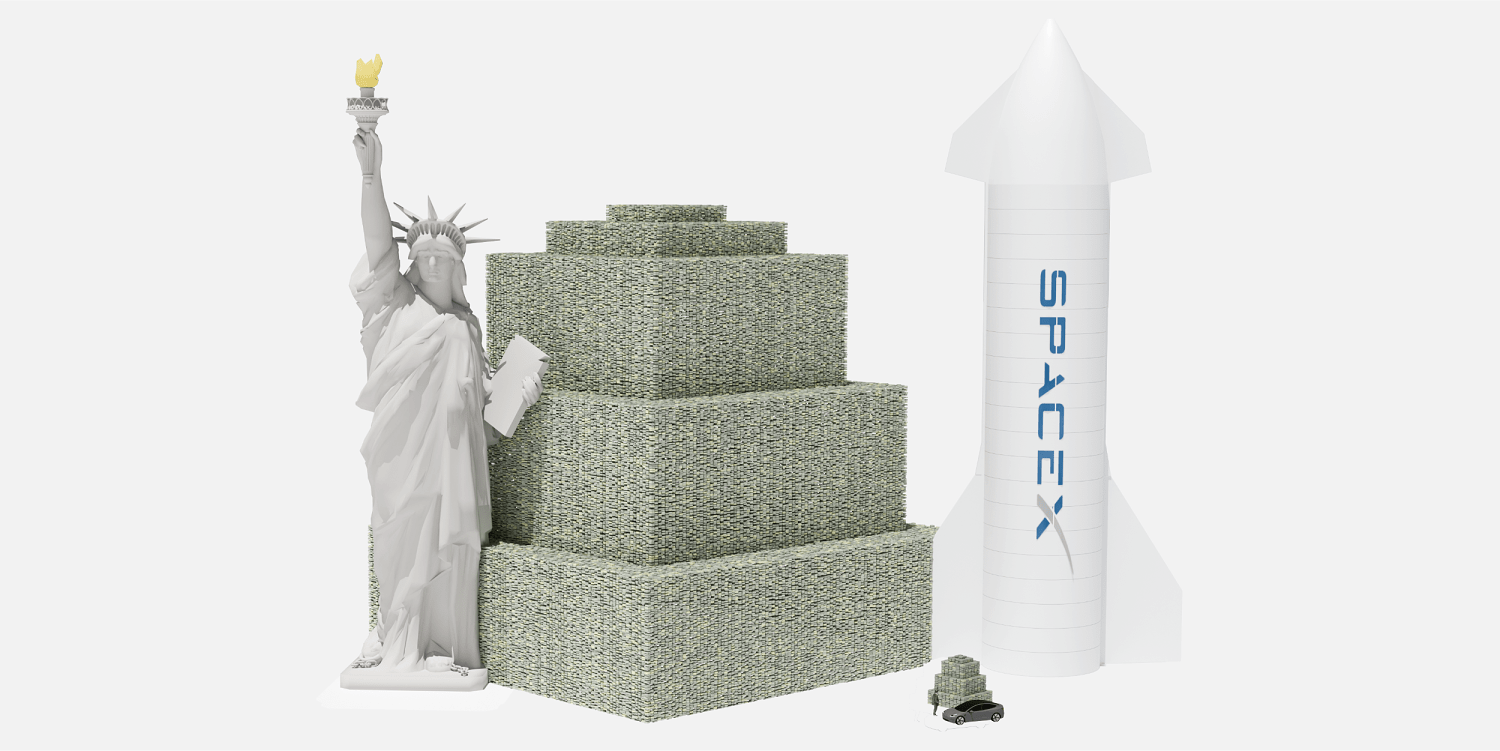
- The Billion-Dollar Pallet: One billion dollars demands 100,000 packets. When packed efficiently for industrial shipping, this quantity requires standard wooden pallets. A single pallet, stacked to an operational height of roughly five feet, accommodates $100 million in $100 bills, weighing approximately 2,200 pounds. Therefore, a billion dollars requires exactly 10 independent industrial pallets.
When this scaling formula is applied to one trillion dollars, the physical infrastructure requirements shift from a warehouse operation to a massive logistics network. One trillion dollars formatted in $100 bills requires 10,000 industrial pallets.
Arranged in a standard double-stacked warehouse configuration, these pallets occupy an active footprint equivalent to a commercial fulfillment center or a major airport hangar. The total weight of this asset class scales to 10,000 metric tons, requiring a fleet of roughly 400 standard cargo aircraft to transport.
Temporal Scaling and Velocity
While volumetric models illustrate spatial magnitude, temporal frameworks expose the vast gaps between numerical orders of magnitude. Time acts as a strict, linear baseline that clarifies scale variations that spatial dimensions can obscure.
Evaluating these numbers through the metric of seconds highlights the non-linear expansion that occurs between each numerical tier:
- One Million Seconds: One million seconds ticks by in approximately 11.5 days. This duration represents a standard corporate sprint cycle or a brief vacation window.
- One Billion Seconds: One billion seconds scales to 31.7 years. This duration spans a significant portion of an average human career, tracking the gap between entry-level employment and executive retirement.
- One Trillion Seconds: One trillion seconds scales to 31,709 years. This duration extends backward past the dawn of recorded human civilization, deep into the Upper Paleolithic era.
This structural gap underscores why standard corporate performance metrics are frequently misjudged. When a public enterprise operates at a trillion-dollar valuation, its baseline activities operate on a scale fundamentally distinct from a billion-dollar mid-cap competitor.
Consider transactional velocity. If an organization deployed capital at a continuous rate of one dollar per second, a one-million-dollar cash reserve would sustain operations for less than two weeks. A one-billion-dollar fund would provide runway for over three decades. A one-trillion-dollar pool would remain solvent for over 31,000 years, assuming a zero-interest environment and no inflationary decay.
Systemic Fiscal Dynamics and Market Architecture
Moving past physical and temporal models, analyzing one trillion dollars within macroeconomic networks reveals its systemic impact. At this level, a trillion dollars ceases to be a passive metric and becomes an active economic force capable of altering market liquidity and sovereign debt profiles.
Corporate Capitalization and Concentration
The emergence of corporate entities carrying multi-trillion-dollar market capitalizations marks a major shift in capital concentration. A capitalization of $3 trillion for a single technology enterprise does not mean the firm holds that volume of cash; instead, it reflects the discounted present value of its projected future cash flows.
This scale alters typical index dynamics. In capitalization-weighted indexes like the S&P 500, a cluster of multi-trillion-dollar firms can drive the entire index's direction. This concentration creates a structural imbalance where broader market performance metrics can mask underlying weakness in the remaining 490+ component companies.
Sovereign Debt and Monetary Aggregates
On the sovereign balance sheet, one trillion units represents the baseline increment for contemporary fiscal accounting. When a nation's sovereign debt increases by one trillion dollars annually, the underlying mechanics can be broken down into a specific cost function:
$$\text{Annual Debt Service} = \Delta \text{Debt} \times \text{Average Weighted Interest Rate}$$
If the state issues $1 trillion in new treasury instruments within a macroeconomic climate averaging a 4% yield, it locks in an irreversible $40 billion annual debt service obligation. This structural expense directly crowds out discretionary fiscal spending without adding to infrastructure or public assets.
To contextualize this within global wealth pools, consider the total supply of physical currency. The narrow money supply (M1)—including physical coins, paper currency, and immediate demand deposits across major global economies—proves that a trillion dollars remains a scarce fraction of total global liquidity.
The total volume of physical U.S. currency in global circulation sits at roughly $2.3 trillion. Consequently, a single trillion-dollar capital pool commands nearly half of all physical U.S. banknotes globally, illustrating the massive scale of institutional asset concentrations relative to actual physical currency.
Institutional Resource Allocation Strategy
For institutional allocators, corporate strategists, and portfolio managers, operating within environments influenced by trillion-dollar balances requires specialized risk and operational frameworks. Asset managers cannot deploy capital at this scale using standard open-market mechanisms without triggering severe adverse price movements.
The first strategic limitation is the absorption capacity of the target asset class. When a sovereign wealth fund or a mega-cap asset manager oversees trillions in assets under management, the available investment universe shrinks dramatically. Deploying $10 billion into a mid-cap company with a $5 billion valuation is structurally impossible without taking the firm private or triggering massive asset inflation.
This dynamic forces mega-cap capital into highly liquid, large-scale asset classes: sovereign treasuries, investment-grade corporate debt, and multi-trillion-dollar equities. This concentration trend creates an asset-insulation bottleneck, artificially inflating the valuations of top-tier equities while depriving smaller market tiers of institutional liquidity.
The second operational challenge involves liquidity management and execution slippage. Moving large blocks of capital requires sophisticated algorithmic execution to hide market intentions. Portfolio rebalancing at this scale cannot be done in single trading sessions; instead, it must be broken down over fiscal quarters using dark pools and direct block trades to avoid destabilizing market equilibrium.
To build an effective corporate strategy in an economy defined by these massive values, organizations must run their financial projections through strict scale-validation filters:
- Isolate the Real Base Unit: When reviewing financial models or macroeconomic data, convert all figures into scientific notation ($10^6, 10^9, 10^{12}$). This convention strips away the deceptive linguistic similarities between the terms million, billion, and trillion, forcing teams to evaluate the actual exponential gaps in scale.
- Model Capital Liquidity Constraints: Before executing a major expansion or capital deployment strategy, calculate the market capacity of the target environment. If the planned capital deployment exceeds 5% of the average daily volume of that asset market, the execution plan must be re-engineered to prevent self-induced price distortion.
- Stress-Test Cost Profiles Against Debt Inflation: Organizations must continuously audit their capital structures against shifting sovereign interest rates. As government borrowing expands by trillions annually, the resulting pressure on benchmark interest rates directly raises the cost of capital for corporate refinancing, changing the net present value of long-term development projects.